HI @marukqs, just received back answers to your questions from the engineering team:
The HEX file is loaded to SRAM of LMS7002M microcontroller, so it can’t brick the board.
Yes, it is possible to change TX and RX channels:
RX channel can be changed in line 16:
LNA = ‘LNAH’
Change it to
LNA = ‘LNAL’
to use LNAL.
TX channel is selected in lines 205 and 206:
TRF.SEL_BAND1_TRF = 0
TRF.SEL_BAND2_TRF = 1
Change it to
TRF.SEL_BAND1_TRF = 1
TRF.SEL_BAND2_TRF = 0
to get the low frequency output.
Frequency band can be selected by changing the starFreq, endFreq and nPoints:
startFreq= 2.30e9
endFreq = 2.6e9
nPoints = 101
Hi Andrew,
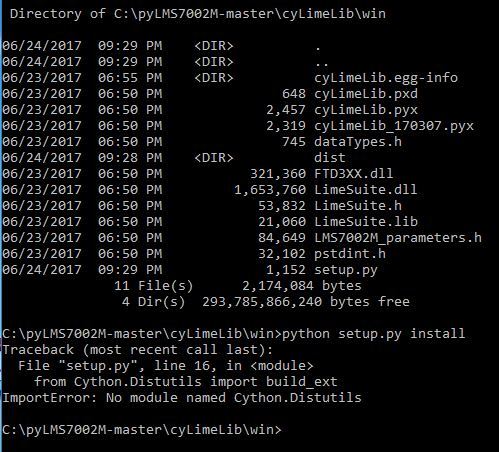
I got my LimeSDR a couple of days ago and I am trying to install cyLimeLib in order to run the VNA utils.
I am using 64-bit Win 10. When I try to install the Lib by running setup.py, I get an error:
from Cython.Distutils import build_ext
No module named Cython.Distutils
See below screenshot:
I installed the Microsoft Visual C++ Compiler for Python at my windows 10.
However, I cannot find the Cython library to include in the Python Path and import it.
Is it hidden somewhere? Or am I missing another dependency?
Thanks!
Update: Never mind I got Cython install with pip command.
I thought that pip worked only in Linux, but apparently there is a pip.exe.
Once I put pip.exe in the Path, it run and unstalled the missing libs.
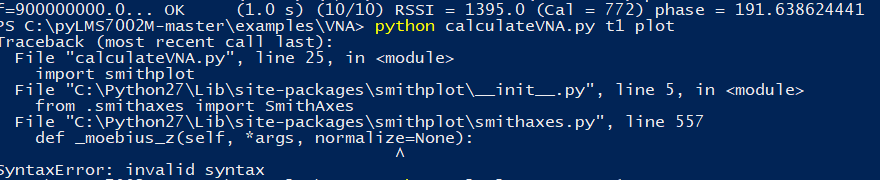
I successfully run measureVNA.py and calculateVNA.py which stored .s1p values in a text file
Then, I tried to use the -plot switch to get the data plotted.
If instead of ‘plot’ switch , I use ‘plotFig’ switch as I can read in the calculateVNA code, I get no fault, the program terminates with exit code (0), but no plots displayed on screen or stored in a file.
I suspected that it may require Python 3.
I am using Win10 and I tried installing numpy at python 3.5 and 3.6 , but it failed in both cases.
Without numpy cannot run the VNA programs.
However, numpy installs OK for Python 2.7 under Win10.
Does anybody know which Python 3 and Numpy versions are compatible under Win10 -64?
This is the other reason i supported lime but been couple of month since got my card and still lack of software support from the company, my cad been sitting here for last couple of month at least i still used my hackrf once in a while.
I think this requires a different way of thinking about it.
The 30MHz mark is the centre of the 60MHz device bandwidth, our radio software just sets it there then slices up smaller bits of that for us to look over and lets us choose a specific frequency in that bandwidth to listen or transmit on.
So instead of looking at making the LimeSDR device do the frequency scanning I think the way to look at this is to start at a 30MHz setting in the SDR then use software itself to run the scan across the available bandwidth, then bounce the LimeSDR up another 60MHz to 90MHz and run the scan again across the available bandwidth, repeating this process across the desired spectrum. This eliminates the timing lag of the SDR frequency change by allowing us to bounce between the two receivers and transmitters when doing frequency centre changes and removes the scanning functions from the LimeSDR out into whatever we were to chose to analyse the supplied band with be it ASIC, FPGA or general purpose computer. An ASIC or FPGA based back end would of course be fastest for running the spectrum scan with the resulting output sent to a GPC for operator display and analysis.
I would bet such an arrangement could approach commercial unit speeds.
If there is enough room the frequency scan functions could be implemented on the existing board with the output being sent out over the USB bus instead of the full spectrum info.
Or even possibly (and probably more easily) just snapshot the entire 60MHZ bandwidth and dump that to the GPC for processing while the centre frequency changes (or not for measurement purposes) for the next snapshot. In that way you get 60MHz chunks of simultaneous spectrum snaps and processing taking place during the lag time, or even after if you don’t need real time.
Has anyone gotten the lag time for the LimeSDR frequency changes?
It’s probably pretty close to the lag time of the main oscillator I would think.
With a nominal start time of 10ms to 90% output on a frequency change the installed Rakon means we can bounce up the frequency centres from 30MHz to 3800MHz continuously tuning without measuring in 60MHz jumps in roughly 700ms including command timing. 64 jumps covers the entire available spectrum so then it’s just a matter of adding the data dump time to snapshot the 60MHz chunk and get it back to the GPC and you have the scan rate minus any processing time, Processing at that rate can be done after the fact to capture as close to a continuous real time spectrum use picture as possible give or take a second or two over 3800MHz and only needs to be done on the bit of spectrum that is of interest for that measurement.
Quicker if there is no frequency hop required, then it is all data transfer and processing time for the 60MHz chunk (or slice thereof) of interest.
This then begs the question of how wide of a bandwidth can this transmit at once, a 60MHz wide white noise output that is of stable amplitude across the spectrum (at least a repeatable variance curve that can be corrected for) and no tracking generator needed, just dump 60MHz of noise out at once and listen to it as it comes back in for processing for whatever you are looking for except maybe phase stuff as others have pointed out.
Since I’ve now made the line STR work nicely as a sinewave signal generator, I thought about extending it to work as a vector network analyser.
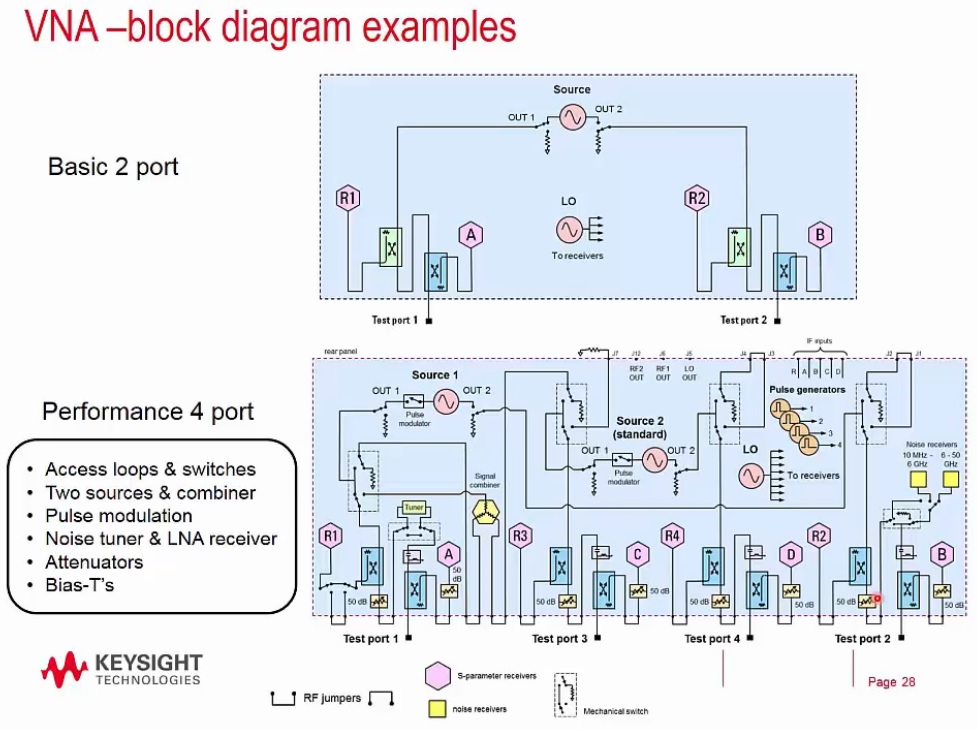
However, one thing confuses me, from my independent research it sounds like about 4 directional couplers are required to actually build a vector network analyser. How can the line STR possibly work on its own without them?
Here are some block diagrams of what a Vna might look like, one of them is simple the other is more complicated: